PROFITABILITY
Profitability calculator
Enter your income and costs. Then adjust your monitoring assumptions.
 Meet SmartSoil
Spore monitoring, climate information and profitability tools. SmartSoil brings together different ways to support your crop decisions.
* Indicator from the BID Lab project closing report (July 2026). Results from assisted monitoring.
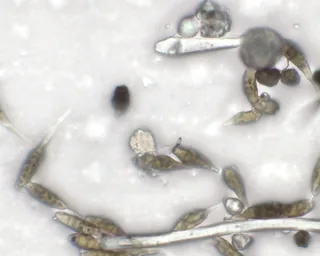
A real sample.
THE SMARTSOIL WORLD
Everything runs on AgriGuardian, our artificial intelligence model trained with field data from Paraguay.
Microscopy and artificial intelligence for spore analysis.
Explore the solutions ↗02 / INTERPRETClimate information to support risk assessment in your fields.
Meet CliMap ↗03 / PLANProfitability and conversions for your crop season.
Explore tools ↓CLIMAP / CLIMATE CONTEXT
CliMap is available now. Draw your fields on the satellite map and receive WhatsApp alerts for rust and Cercospora risk. No equipment in the field.
Try CliMapFrom USD 1.10 per hectare per crop season, depending on area.
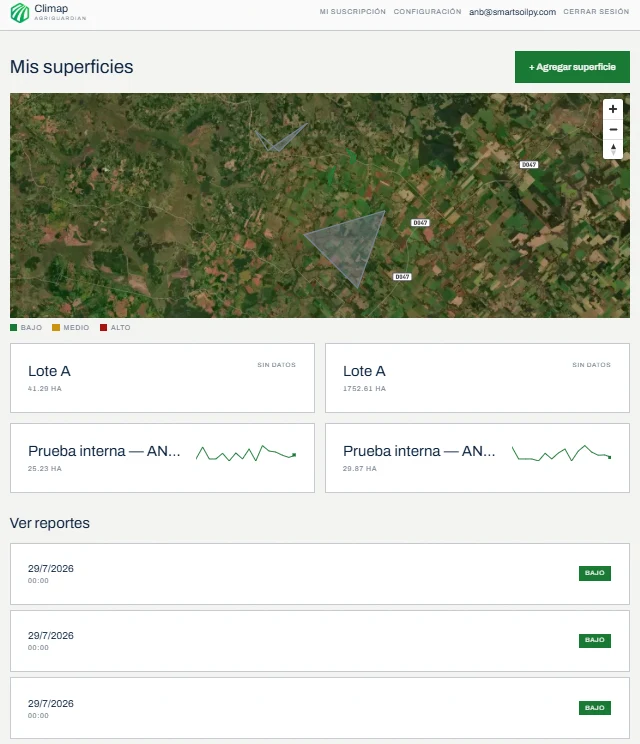
Temperature, humidity and rainfall to assess field risk.
TOOLS / FOR EVERY DAY
Estimate your crop margin and convert units.
PROFITABILITY
Enter your income and costs. Then adjust your monitoring assumptions.
CONVERTER
Bushel: soybean/wheat 60 lb; corn 56 lb; rice 45 lb. Sack: 60 kg; rice 50 kg.
Spore monitoring
Assisted monitoring is in operation. XporeBuster is undergoing field trials.
In operation · 5 crop seasons
We install the spore traps and analyze the samples with MiniLab.
We handle sample collection and analysis.
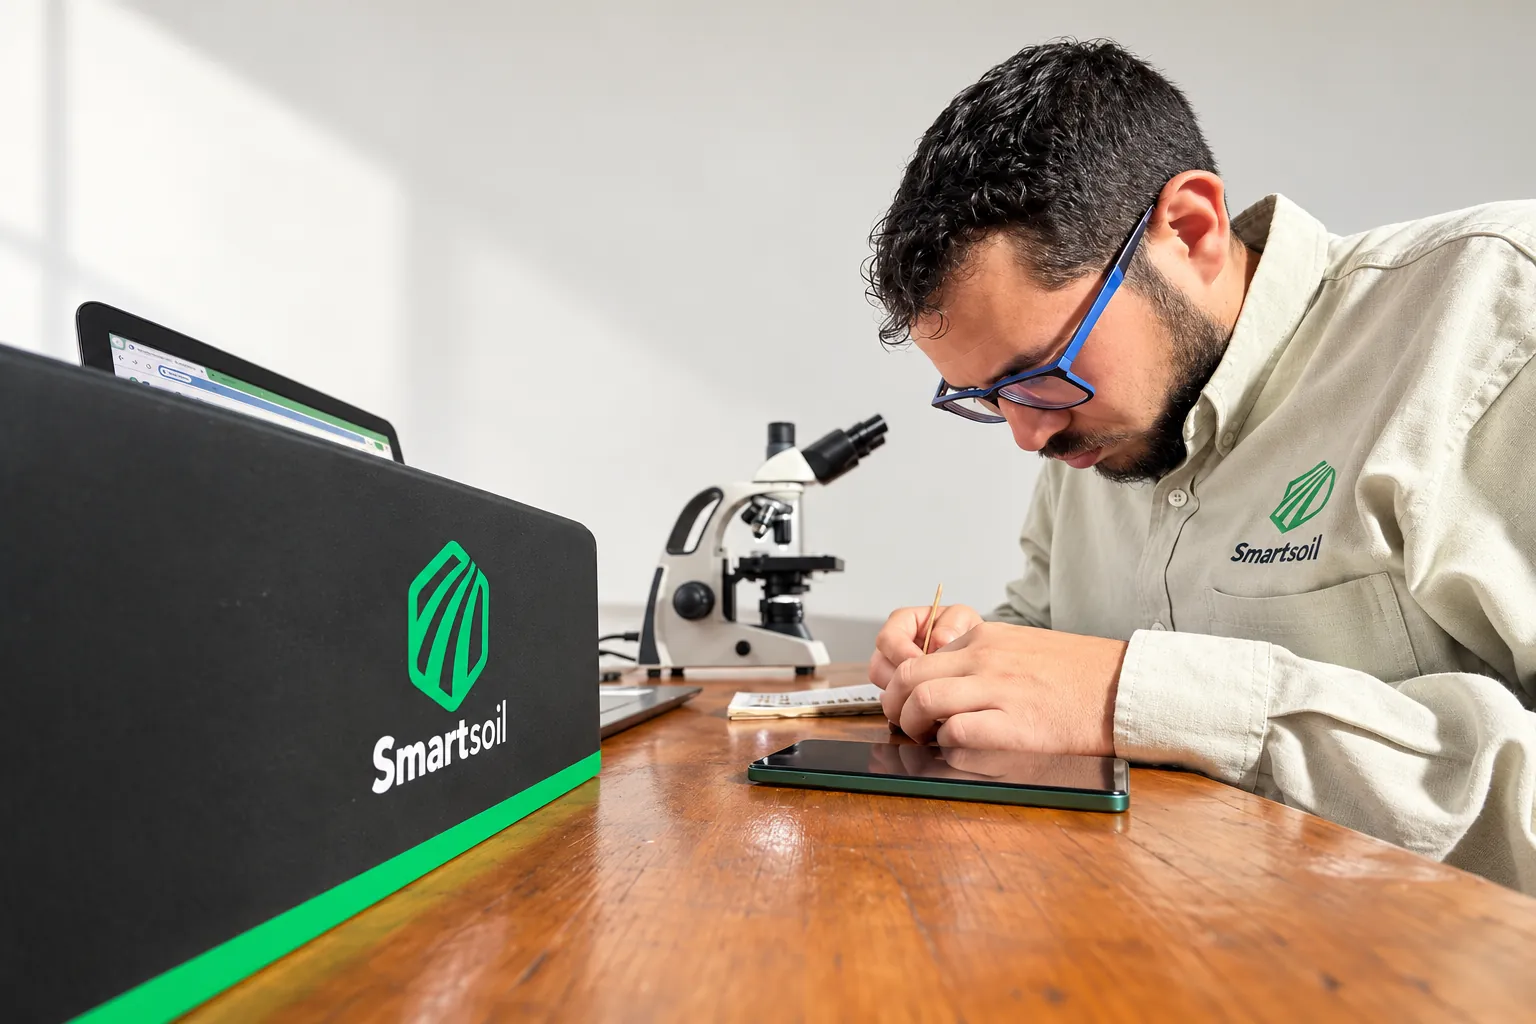
We install the spore traps, collect the samples and analyze them with MiniLab, our automated laboratory. AgriGuardian analyzes the images and the results arrive in a report to review with your agronomist.
Growers and cooperatives who want the information without operating equipment.
AgriGuardian
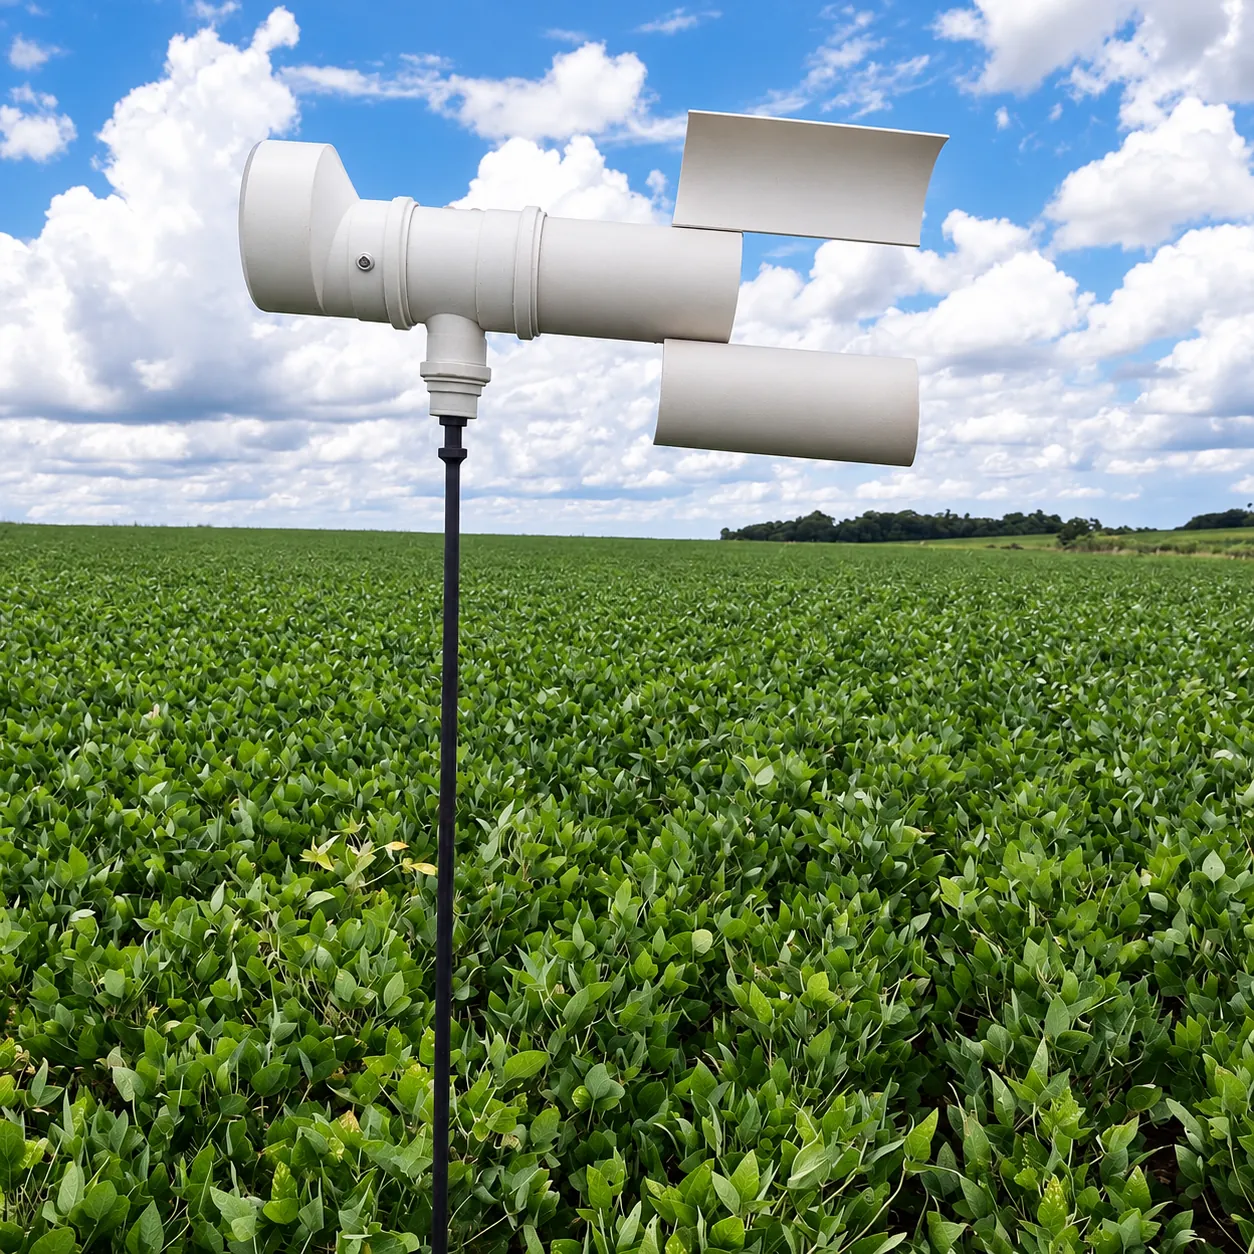
TRL 6 · undergoing field trials
Monitoring stays in the field.
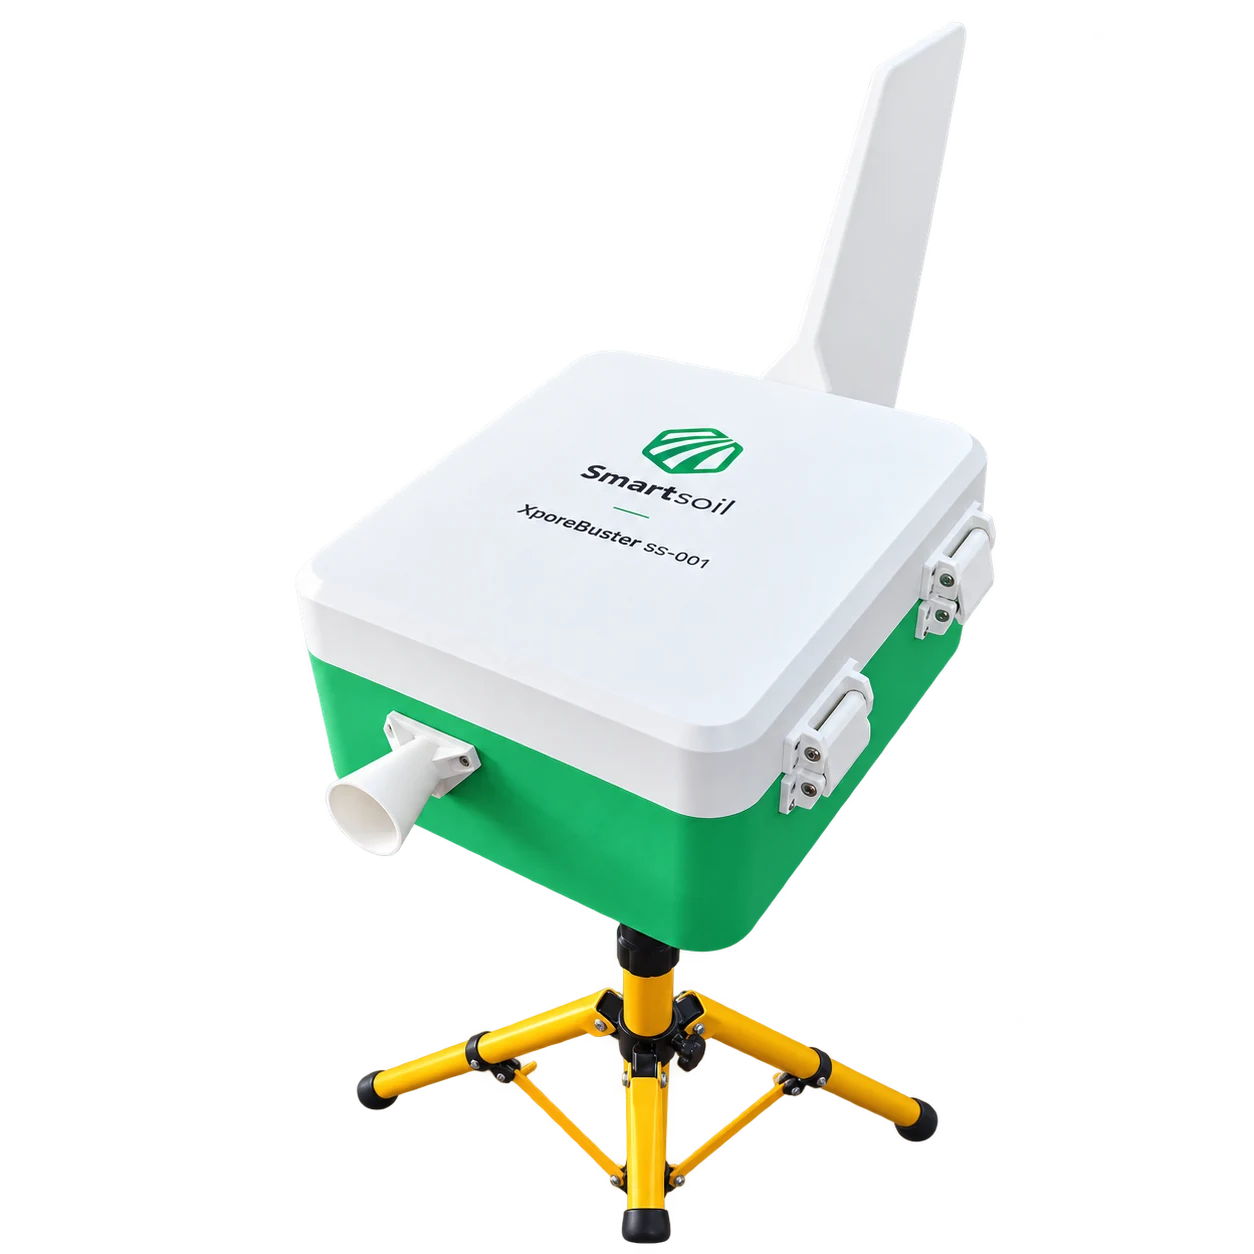
It monitors spores in the field and sends images to the SmartSoil server for AI analysis. The grower receives the results in a report.
Learn about XporeBusterOperations looking to automate capture and analysis from the field.
A VIEW THAT ADDS INFORMATION
What we monitor: Asian soybean rust, the Cercospora complex, anthracnose and powdery mildew in soybean. Wheat, corn and rice: crop-season pilots.
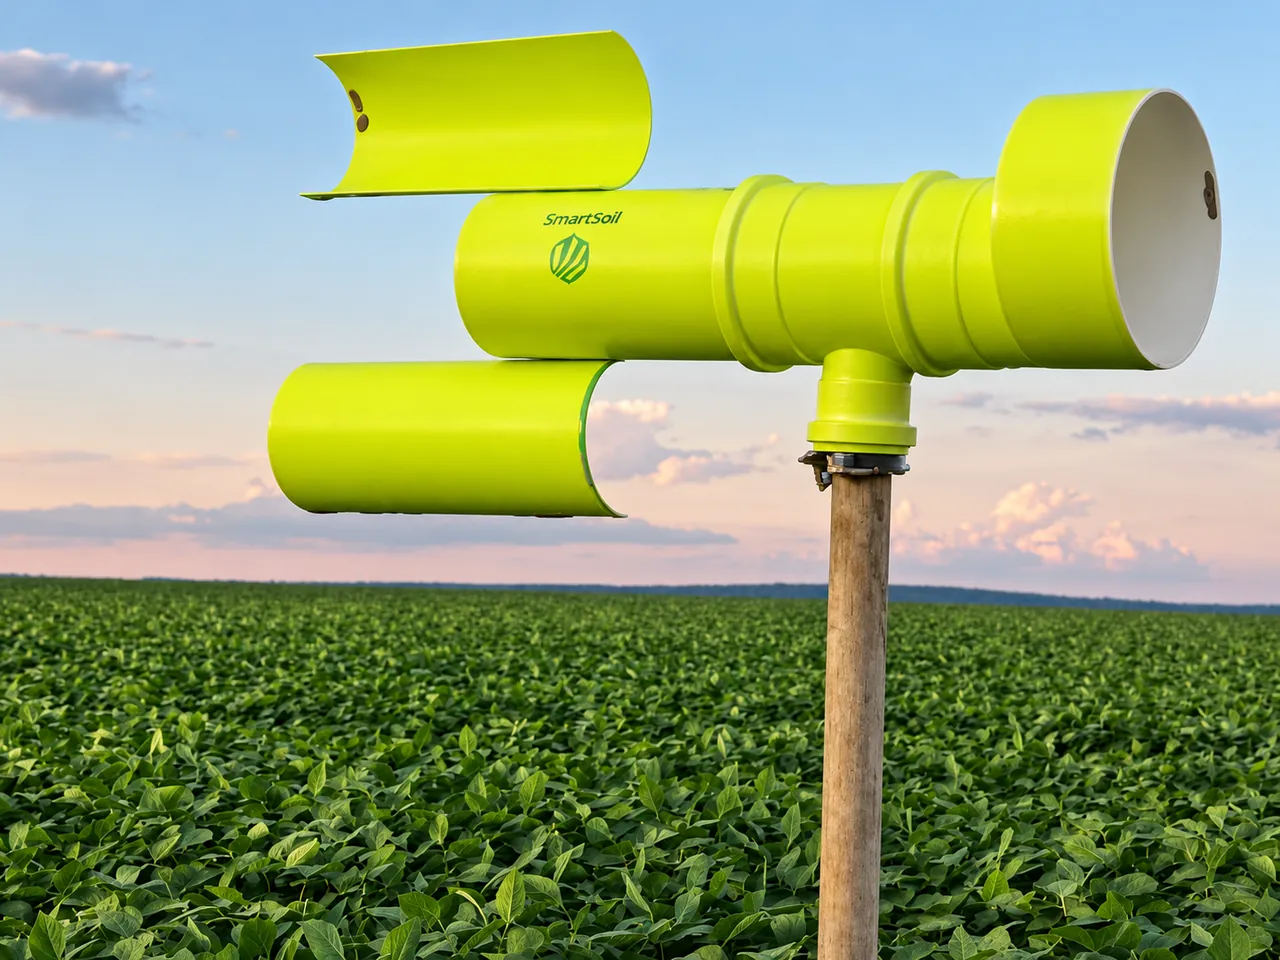
The spore count is the starting point of the report.
The results are considered alongside your team's knowledge of the crop.
The suggestion opens a conversation with the agronomist about the next step.
 MICROSCOPY / SMARTSOIL IMAGERY
ONE SAMPLE. MORE INFORMATION.
AgriGuardian helps identify and count spores from microscopic images. Agronomic interpretation provides context.
An air sample from the field starts the process.
Microscopy captures the images. Artificial intelligence helps identify and count spores.
A report brings together the count, risk level and suggestion to review with your agronomist.
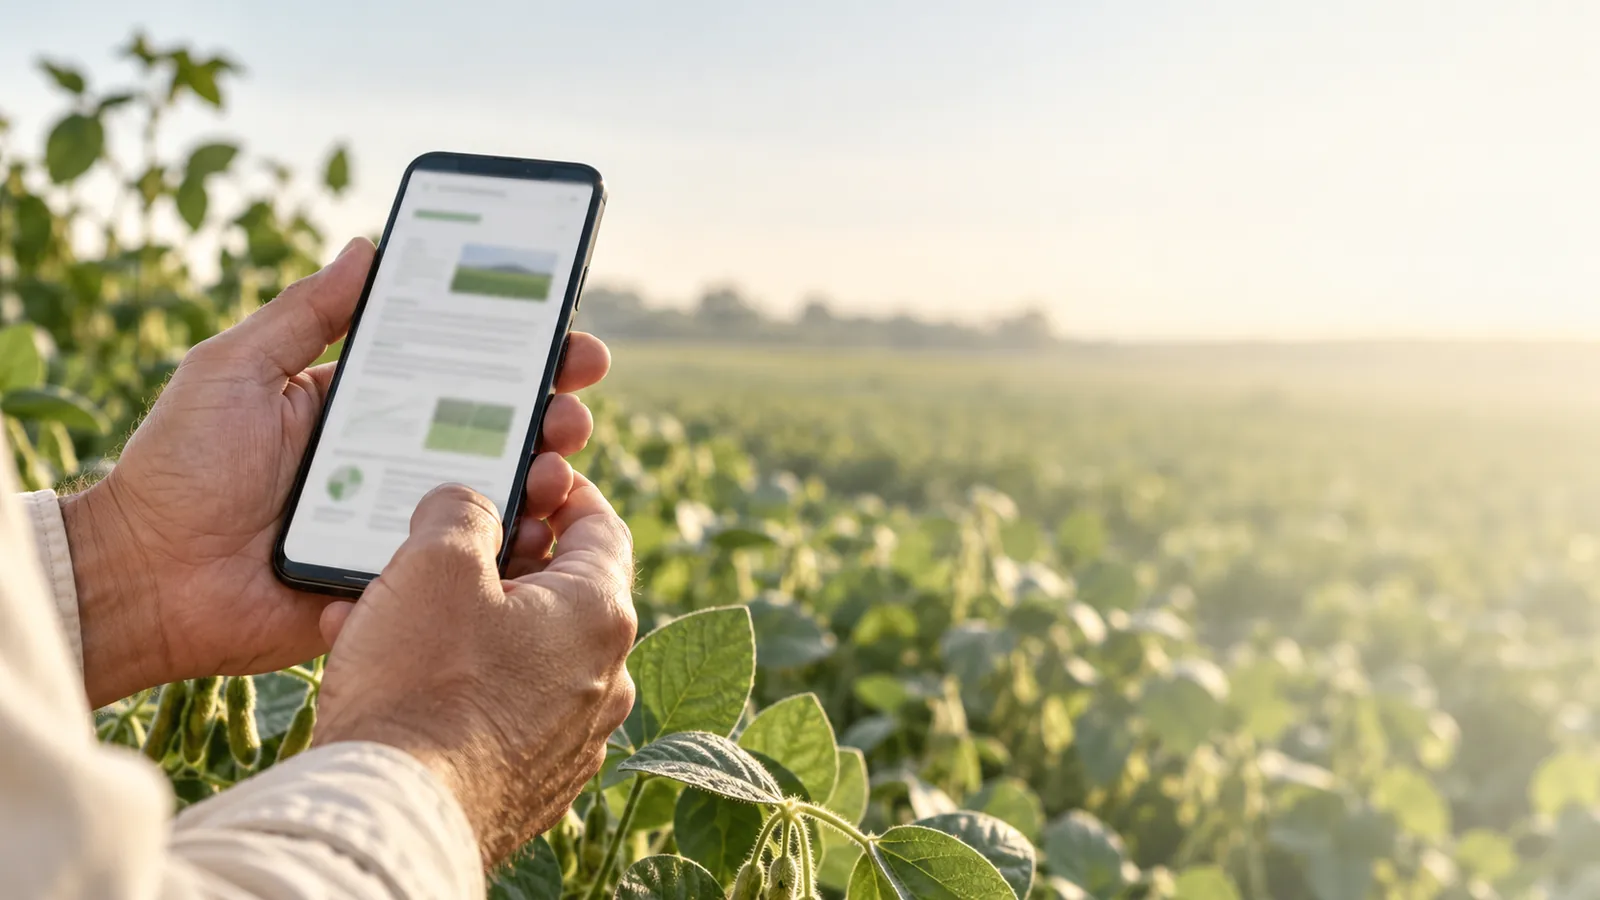
FROM ANALYSIS TO YOUR FIELD
Receive your report by WhatsApp or email. A clear format to share with your team and support crop monitoring.
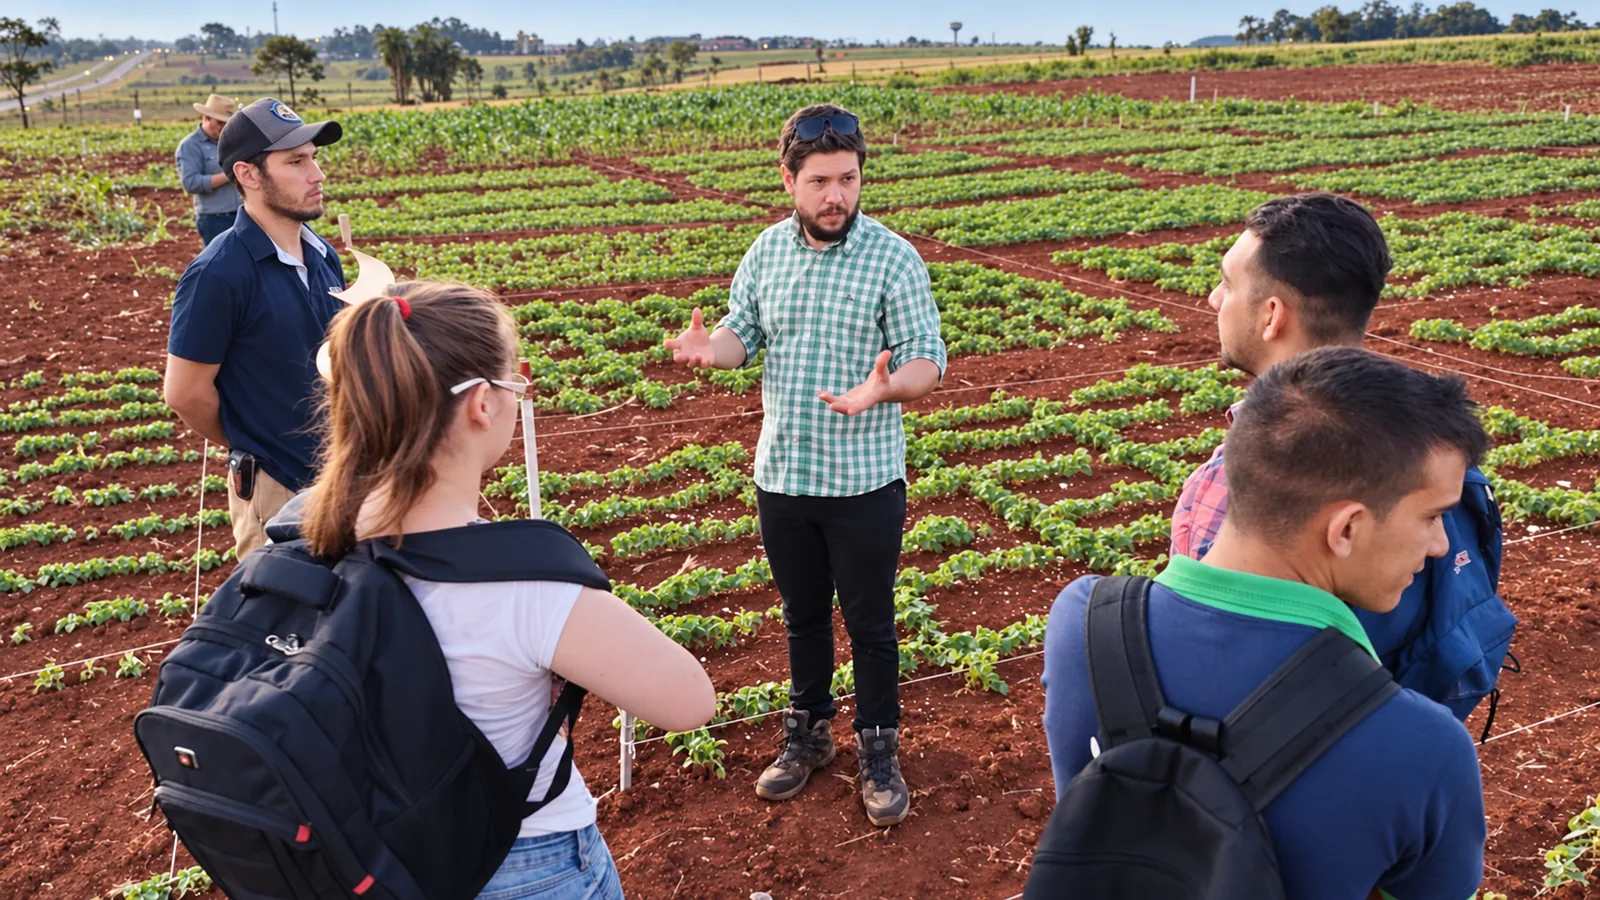
TECHNOLOGY THAT SERVES PEOPLE
One report can enrich different conversations. SmartSoil provides information so the people who know the crop can review it together.
Tell us how your team worksReceive results to share with your advisor and support crop-season monitoring.
Another source of information to compare with your field observations.
Understand the sample's journey and work with a shared report.
THE RESULTS ALSO HAVE A JOURNEY
The PDF travels by email or WhatsApp. Save it, share it and consult it again when reviewing the crop with your team.
The sample results in a document.
The same information with your advisor.
The report alongside field observations.
A tool that serves the agronomist. The report supports professional judgment and field observations.
BEFORE YOU START
The right solution starts with understanding your operation.
No. We also offer CliMap for climate risk, along with profitability and conversion tools.
With assisted monitoring, SmartSoil installs the spore traps, collects the samples and analyzes them with MiniLab. XporeBuster performs capture and microscopy from the field. AgriGuardian analyzes the images.
Assisted monitoring is in operation: we install spore traps and analyze the samples in MiniLab, our automated laboratory. XporeBuster has reached TRL 6 and its first commercial units are undergoing field trials in Paraguay. CliMap is already available.
In a PDF report by email or WhatsApp, with spore count, risk level and a suggestion for agronomic review.
No. The analysis provides information to support crop monitoring. Management decisions must consider the field context and professional judgment.
CliMap assesses climate risk without field equipment. Assisted monitoring delivers results without requiring you to operate equipment. XporeBuster aims to automate monitoring from the field and is still undergoing field trials.
Your crop, location, area and current monitoring process. It also helps to know who will review the results.
CliMap: from USD 1.10 per hectare per crop season, depending on area. Assisted monitoring: a quote based on area and demand; in Paraguay, the list starts at USD 8/ha per crop season. XporeBuster: contact us.
DIRECTORS

Chief Executive Officer

Chief Scientist
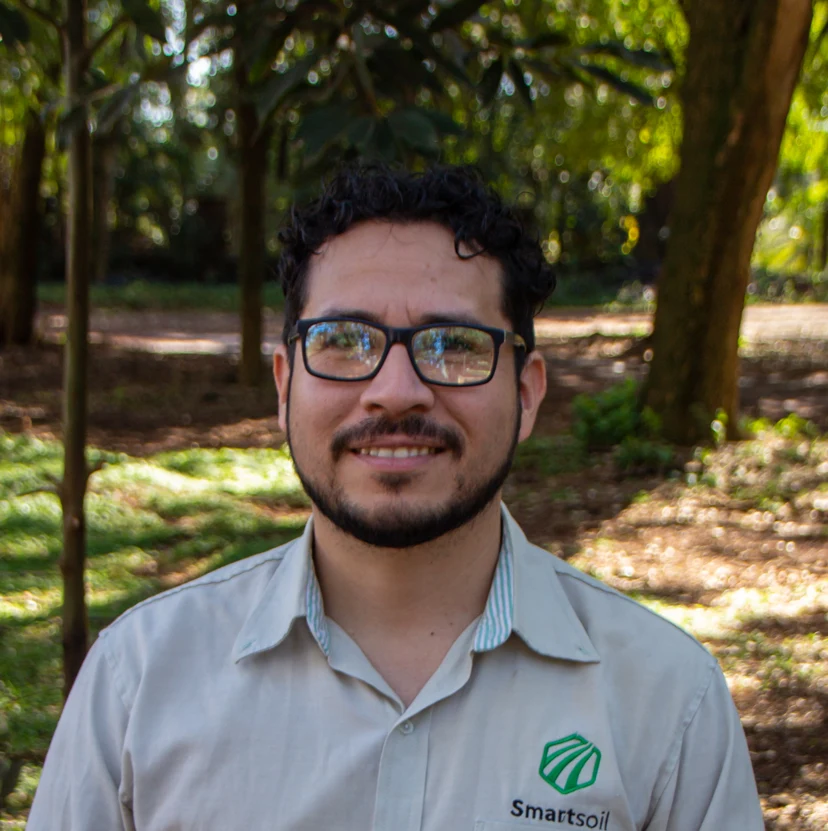
Chief Operating Officer
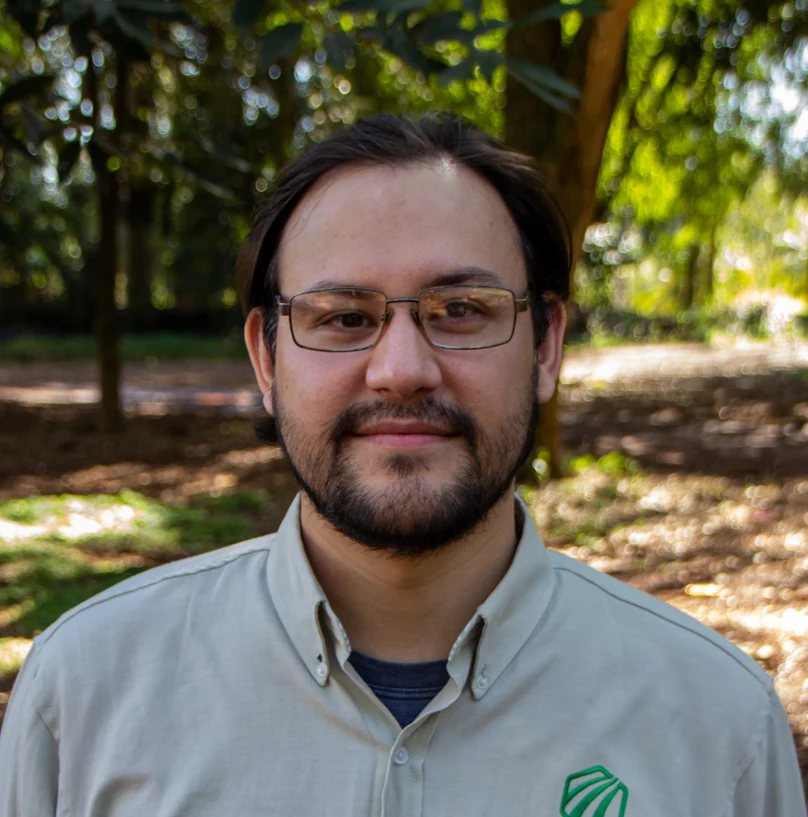
Chief Technology Officer
LET'S TALK ABOUT YOUR FIELD
Tell us what you need to monitor and find the solution for your field.
Prepare your inquiry and send it by email.